Pune, India
Pune, India
White Label Project
White Label Project
MedNex: Pathology Digital Dashboard System
MedNex: Pathology Digital Dashboard System
A real-time laboratory management dashboard that transformed paper-based clinics into data-driven businesses, enabling a pathology lab chain to confidently expand across multiple cities.
A real-time laboratory management dashboard that transformed paper-based clinics into data-driven businesses, enabling a pathology lab chain to confidently expand across multiple cities.
-58%
-58%
Task Completion Time
Task Completion Time
+46%
+46%
First Attempt Success Rate
First Attempt Success Rate
8/10
8/10
Decision Confidence
Decision Confidence
Data Analysis
Data Analysis
Pathological Sector
Pathological Sector
End-to-End Design
End-to-End Design
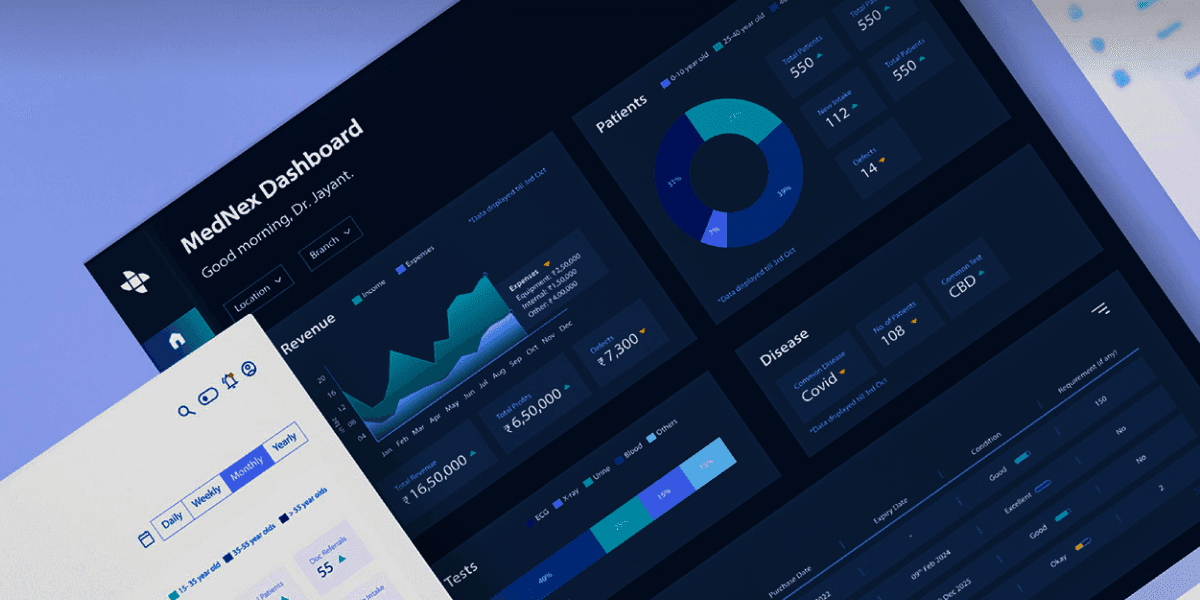
Dashboard
Dashboard
Executive Summary
Executive Summary
Project Data
My Role
Lead Designer
Lead Designer
Team
2 Technical Specialists, 1 PM, and 1 Designer
2 Technical Specialists, 1 PM, and 1 Designer
Timeline
5 months
5 months
Focus
Healthcare, Laboratory Management, Business Intelligence
Healthcare, Laboratory Management, Business Intelligence
Context
MedNex Dashboard is a digital solution for pathological laboratories to centralize and manage clinic information across multiple locations. The platform enables Dr. Jayant Tipnis, owner of a chain of pathological labs in Pune, to expand his business into tier-2 cities (Delhi, Nashik, Bangalore) by providing real-time access to patient data, revenue analytics, equipment tracking, and employee management without the need for physical branch visits.
MedNex Dashboard is a digital solution for pathological laboratories to centralize and manage clinic information across multiple locations. The platform enables Dr. Jayant Tipnis, owner of a chain of pathological labs in Pune, to expand his business into tier-2 cities (Delhi, Nashik, Bangalore) by providing real-time access to patient data, revenue analytics, equipment tracking, and employee management without the need for physical branch visits.
Process
Investigate
Interviewed stakeholders, employees, pathologists, and external doctors to understand the offline system & identify pain points and requirements for digital transformation
Investigate
Interviewed stakeholders, employees, pathologists, and external doctors to understand the offline system & identify pain points and requirements for digital transformation
Analyse
Researched a competing lab using CrelioHealth to understand existing digital solutions and identify opportunities for differentiation
Analyse
Researched a competing lab using CrelioHealth to understand existing digital solutions and identify opportunities for differentiation
Iteration
Created information architecture, low-fidelity wireframes, and iteratively refined based on stakeholder feedback to ensure alignment with business goals
Iteration
Created information architecture, low-fidelity wireframes, and iteratively refined based on stakeholder feedback to ensure alignment with business goals
Validate
Developed high-fidelity prototypes with design system for consistent visual language across dashboards and conducting usability testing with SMEs.
Validate
Developed high-fidelity prototypes with design system for consistent visual language across dashboards and conducting usability testing with SMEs.
Problem
Solution
Impact
Invisible Data: Dr. Jayant had no visibility into branch performance, requiring physical visits to understand revenue, patient demographics, test demand, or equipment status
Invisible Data: Dr. Jayant had no visibility into branch performance, requiring physical visits to understand revenue, patient demographics, test demand, or equipment status
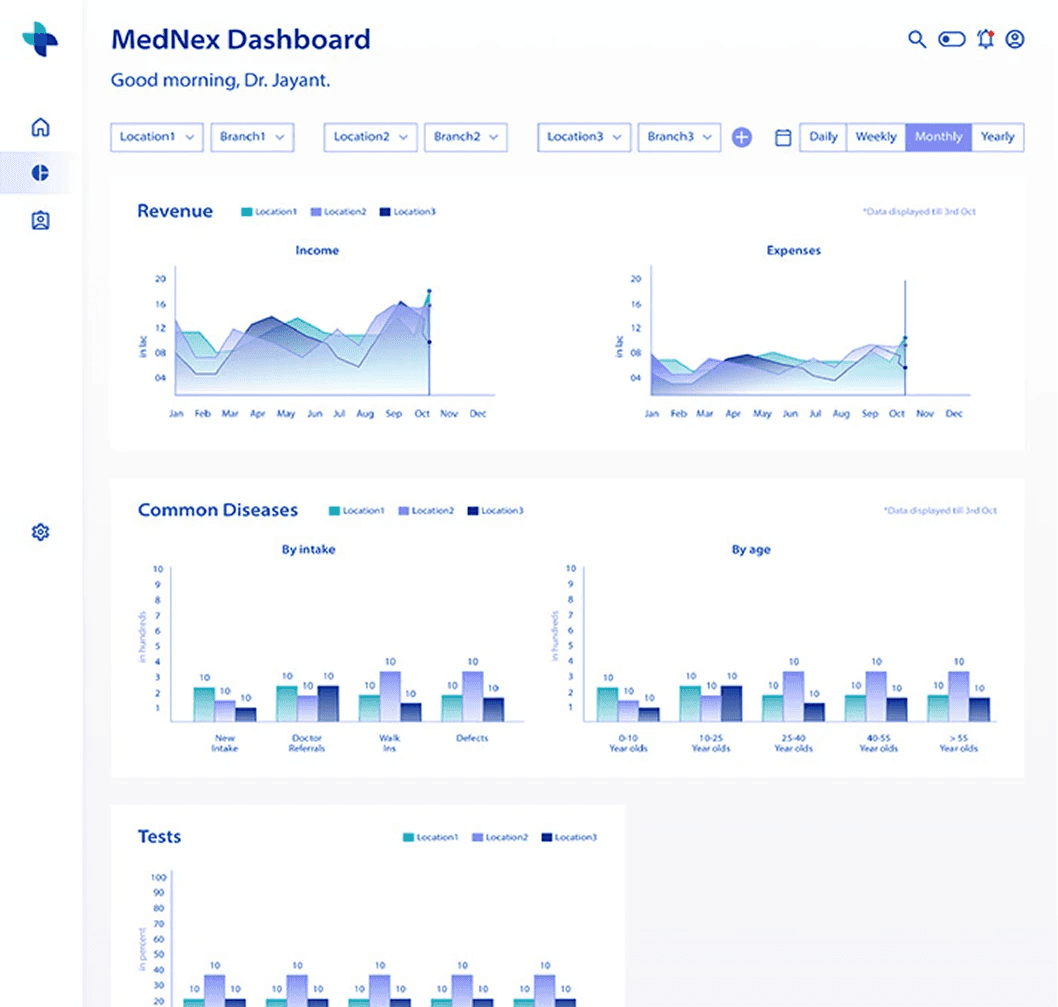
Real-Time Dashboard: Centralized homepage displaying revenue trends, patient volume, test distribution, and disease patterns with location/date filters for cross-branch analysis
Real-Time Dashboard: Centralized homepage displaying revenue trends, patient volume, test distribution, and disease patterns with location/date filters for cross-branch analysis
Data-Driven Expansion: Enabled informed decisions about which cities to expand into based on comparative performance metrics and local health needs
Data-Driven Expansion: Enabled informed decisions about which cities to expand into based on comparative performance metrics and local health needs
Manual Error Risk: Paper records created data entry bottlenecks, with illegible handwriting leading to transcription errors that could delay patient care
Manual Error Risk: Paper records created data entry bottlenecks, with illegible handwriting leading to transcription errors that could delay patient care
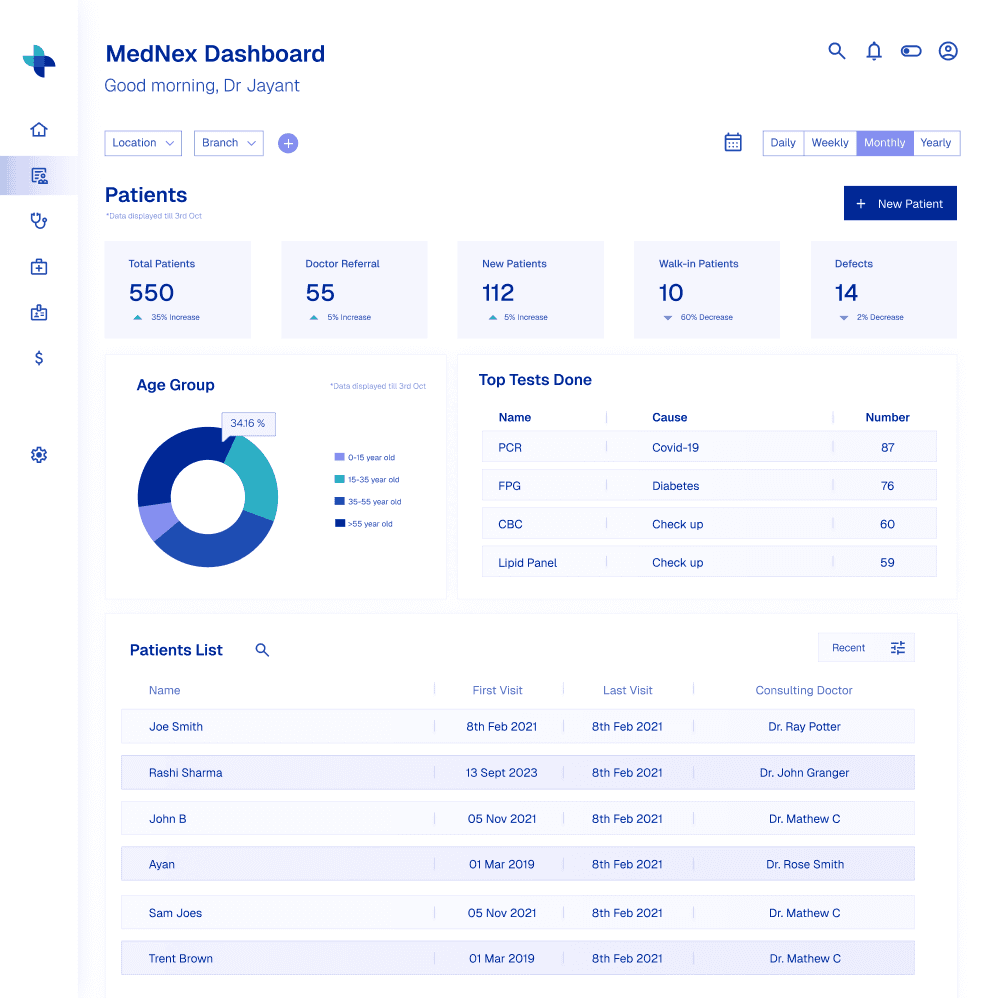
Structured Patient Records: Digital patient profiles with test history, assigned doctors, documents, and searchable records accessible across all stakeholder roles
Structured Patient Records: Digital patient profiles with test history, assigned doctors, documents, and searchable records accessible across all stakeholder roles
Reduced Processing Time: Eliminated double-checking and manual data entry, enabling technicians to focus on testing rather than paperwork
Reduced Processing Time: Eliminated double-checking and manual data entry, enabling technicians to focus on testing rather than paperwork
Financial Opacity: Without centralized financial tracking, Dr. Jayant couldn’t identify underperforming locations or optimize resource allocation
Financial Opacity: Without centralized financial tracking, Dr. Jayant couldn’t identify underperforming locations or optimize resource allocation
Revenue Analytics: Dedicated revenue dashboard breaking down income/expenses by category (tests, equipment, salaries) with time-series visualization
Revenue Analytics: Dedicated revenue dashboard breaking down income/expenses by category (tests, equipment, salaries) with time-series visualization
Strategic Resource Planning: Clear visibility into profit margins and expense patterns to optimize inventory and staffing decisions
Strategic Resource Planning: Clear visibility into profit margins and expense patterns to optimize inventory and staffing decisions
Design Snapshot

Detailed Project Walkthrough
Detailed Project Walkthrough
Detailed Project Walkthrough
Under Construction
Being Redesigned: Please check case study Presentation Deck


Sam.
Let's Connect & Brainstorm the wildest ideas that you wrote in your book when you were a kid!
Sam.
Let's Connect & Brainstorm the wildest ideas that you wrote in your book when you were a kid!
Sam.
Let's Connect & Brainstorm the wildest ideas that you wrote in your book when you were a kid!